In this post, we will cover some popular and best Java Profilers. We will cover following Java Profilers in our post.
Introduction to Java Profilers
As a developer, we always try to write best and efficient code.While writing code for complex and enterprise applications, we may want to get an understanding of the JVM internals
- What is the total memory allocated
- What is the overall impact of changing the code and design?
- Impact of concurrent execution in our application.
- Memory usage for our application.
- Garbage Collection, CPU utilization etc.
- Area of improvements and bottleneck in our applications.
Debugging these kinds of performance issues is always challenging and if these are happening only in a specific environment (say your production environment ) is easy but sometimes not feasible.
Java Profiler is a tool which can help us in all these cases. These profilers work at the JVM level and hook themselves to Java bytecode operations.
[pullquote align=”normal” ]This post is intended to give an overview of the Java profilers and will not cover features in detail. Please refer to feature section on the product home page.[/pullquote]
1. JProfiler
Jprofiler is one of the most used Java Profiler for Java-based standard and enterprise applications. Jprofiler provides plugins to work with all the popular Java IDEs.
Some main features of Jprofiler are
- CPU Profiling (One of the best feature of Jprofiler).
- Heap snapshot analysis.
- Method call chain view.
- Memory profiling.
This is how Jprofiler interface looks like

As mentioned above, Jprofiler provides a way to integrate with all popular Java IDEs.It also provides an option to integrate with the remote machine.
Let’s cover some main features of Jprofiler
1.1 Call Hierarchy
If we want to get an understanding of the memory usage and call hierarchy for the given session, we can click on “all Objects” under Live memory link.

1.2 CPU Profiling
JProfiler offers various ways to record the call tree to optimize for performance.

1.3 Database Profiling
Jprofiler provides good support for JDBC, JPA/Hibernate, and other popular databases.

[pullquote align=”normal”]If you want to try, you can get a trial copy of Jprofiler [/pullquote]
2. YourKit
YourKit is one of the mature and best Java profilers. YourKit core features include
- Local and Remote profiling (Built-in SSH tunneling support).
- CPU Profiling
- Memory Profiling (memory leak, usage etc)
- Thread usage.
- Automated profiling.
- GC analysis.
For the more detailed about the features, please refer YourKit Features
Here is a sample dashboard for our Spring Boot based REST application

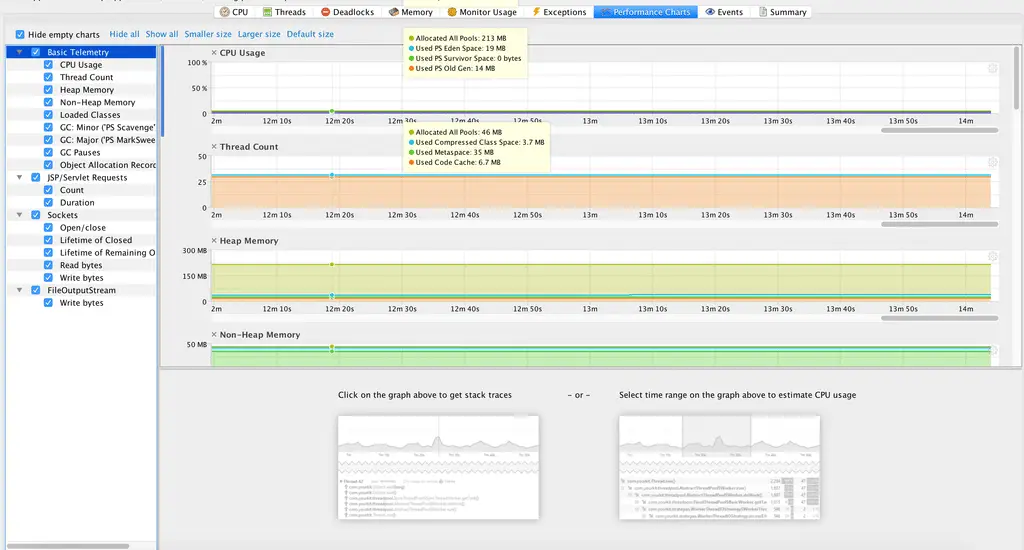
2.1 Performance Chart
Performance chart shows all telemetry graphs in the same place to give you a complete picture of the system
2.2 Thread View
Thread view gives complete pictures of the application’s thread with an option to show “Live”, “Live and Finished” and “Finished” thread view.

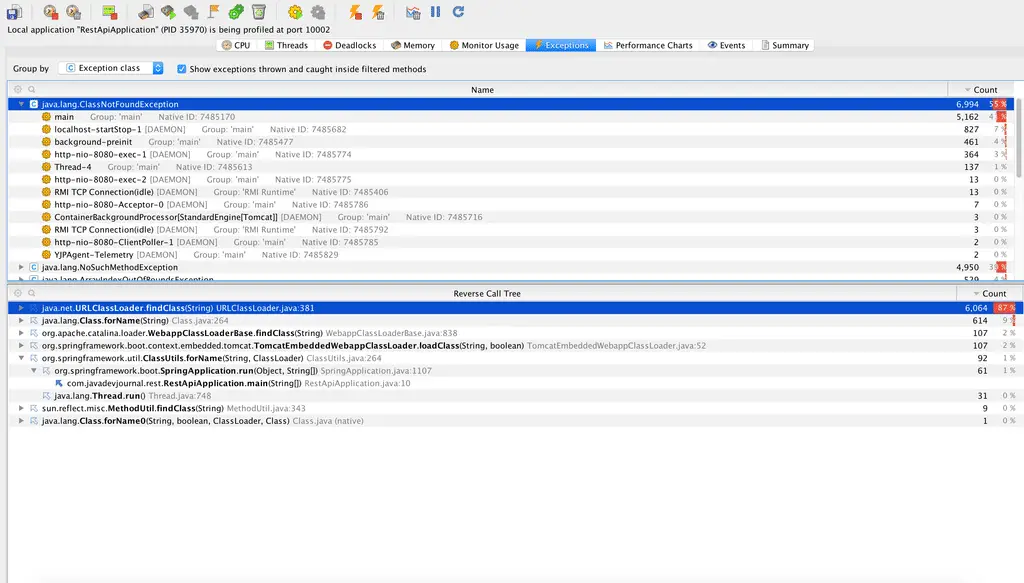
2.3 Exception
One of the main features of Yourkit is its ability to profile thrown Exceptions.
[pullquote align=”normal”]Please refer to YourKit site for getting trial license [/pullquote]
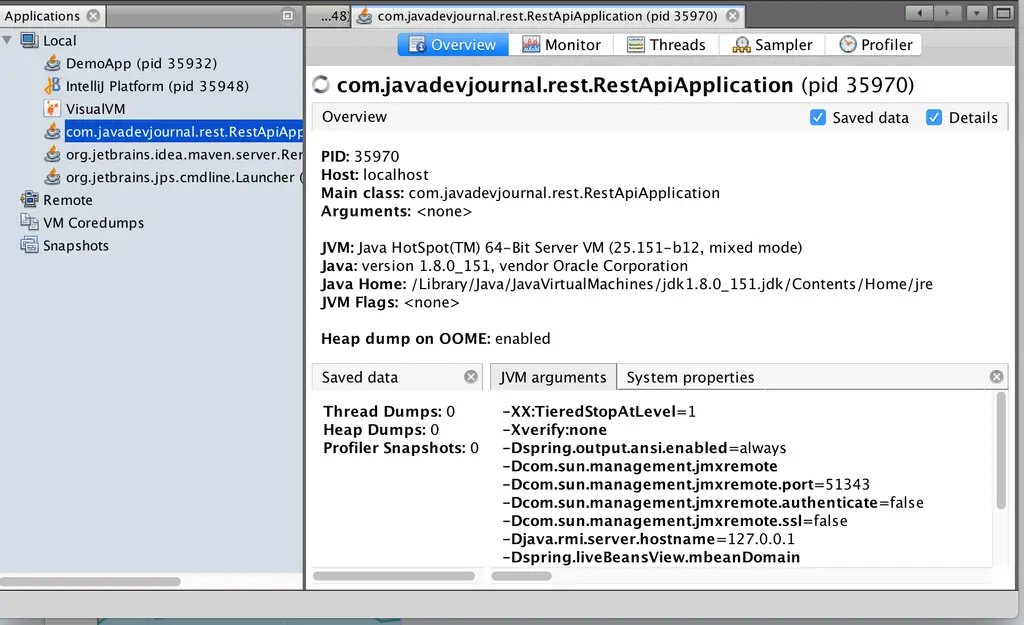
3. Java VisualVM
Java VisualVM is profiler tool provided by Java Development Kit (JDK).VisualVM relies on and works closely with some other tool provided by JDK to get all this data. It has the capabilities to detect all running local and remote VM’s. It also gives the option to configure an additional connection using JMX.
Here is the default layout of Java VisualVM
Some features offered by the Java VisualVM are
- Display Local And Remote Java Processes
- Display Process Configuration And Environment
- Monitor Process Performance And Memory
- Profile Performance And Memory Usage
3.1 Thread View
VisualVM provides a detailed overview of the threads with an option to filter out results based on the requirements

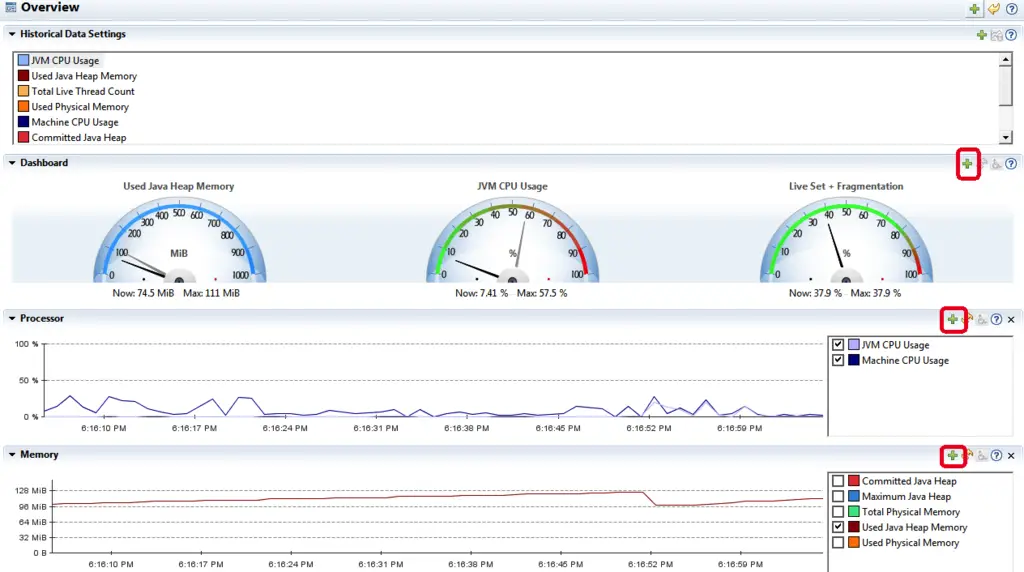
3.2 Application Monitoring

VisualVM also provides an option to take a snapshot of the profiling session. We can use this snapshot at the later stage of the analysis.
[pullquote align=”normal”]One of the advantages of VisualVM is that it comes with JDK.We don’t have to pay any license fees to use this tool [/pullquote]
4. Graal VisualVM
With JDK9, Java VisualVM has been moved to a new place known as GraalVM . Some feature provided by Graal are
- Performance – Graal incorporates our research on compiler technology and offers better peak performance on some workloads than a traditional JVM.
- Embed dynamic languages and native code with sandboxing capabilities.
- Live GraalVM processes and analyzing applications at the guest language level (Heap Viewer)
4. Java Mission Control
Java Mission Control is a Java performance monitoring tool by Oracle which has been shipped with the JDK since Java version 7.It encompasses two JMX Console and Java Flight Recorder. Java Mission Control works by interacting with a JMX agent in a JVM. Flight recorder, with its historical view, provides the ability to see trends in your JVM. Here are more details for the JMC components.
- JFR – Profiling and event collection framework built into the Oracle JDK, gather detailed low level information about JVM and application.
- JMC – Advance toolset for a detailed analysis.
5. APM Profilers
There are other sets of APM tools which provide a different Java profiling for your applications.
Some popular and widely used APM solutions are
- New Relic
- Dynatrace
- Aappdynamics
- Stackify
- Java Mission Control
These tools work entirely different way than the Java profilers explained in above section.
These tools work by installing a java agent on the host machine. These agents will send required information back to the main server for analysis and evaluation.
They design these profilers for
- Use a minimum or negligible resources.
- No impact on production servers
- Send only required information back to the main APM server.
Summary
In this post, we discussed profiling and some of the best Java Profilers. We did not cover different features of these Java Profilers as it needs a separate article for each profiler. Choosing a profiler depends on developer and the level of analysis and information required by the team.