In this post, we will introduce and cover the Spring Boot Actuator. We will cover various features and end point of Spring Boot Actuator.
1. What is Spring Boot Actuator
Spring Boot Actuator is available from the very first release of Spring Boot. It proves several features like health check-up, auditing JVM metrics, log information, caching statics, etc. We have the option to use JMX or HTTP end points to manage and monitor our applications on the production environment.
Actuator also make it easy to integrate with external monitoring systems like Prometheus, Graphite, DataDog, New Relic, etc. The Actuator uses for Micrometer, an application metrics facade to support the integration with external monitoring systems.Actuator make it super easy to integrate our application with any external system with a very minimal configurations.
2. Creating Spring Boot Actuator Application
Let’s create a simple Spring Boot web application with actuator dependencies. We have the option to create the application using IDE (like IntelliJ IDEA) or we can create an application using Spring Boot CLI.
$ spring init --dependencies=web,actuator my-projectIf you prefer a more visual interface to generate an initial structure, we can use the Spring Initializer:
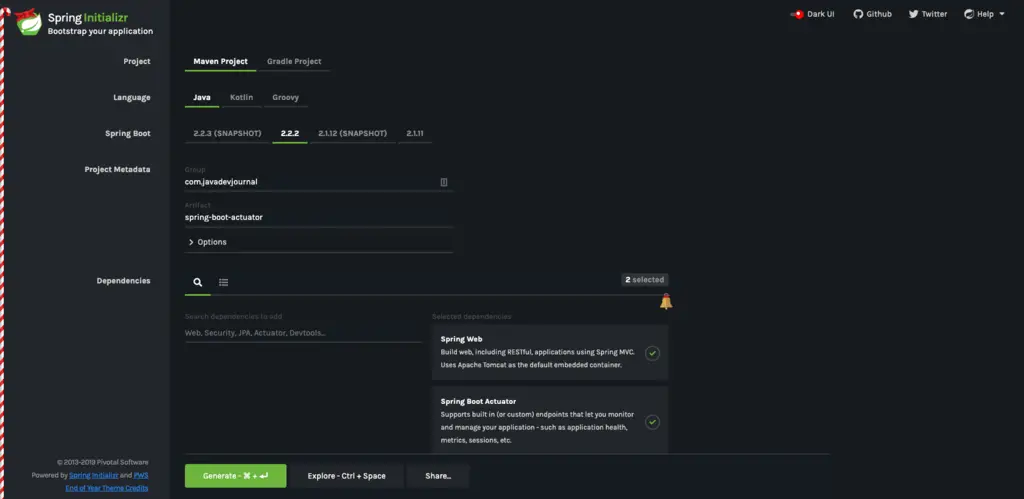
We selected the following dependencies for our application:
- Web starter
- Spring Boot Actuator starter
3. Enabling Actuator to an existing application
All the actuators production-grade features provided through the spring-boot-actuator starter. To enable these features to an existing application, we need to add spring-boot-starter-actuator in the pom.xml file (refer to the official documentation if you are using Gradle or any other build tool)
<dependencies>
   <dependency>
     <groupId>org.springframework.boot</groupId>
     <artifactId>spring-boot-starter-actuator</artifactId>
   </dependency>
</dependencies>
4. Migrating from Actuator 1 to Actuator 2
There are numbers of changes introduced in the Actuator 2.x.If you are migrating from Spring Boot 1.x to 2.x, these are important as some changes introduced in the Actuator are breaking.
- This version support CURD model as compared to R/W under 1.x
- All Actuator endpoints are now placed under the /actuator path.
- Spring Boot 2.0 no longer ships with its own metrics APIs. Instead, it relies on micrometer.io for all application monitoring needs.
New Actuator API is more aligned with the application security rules which made it simple to configure security aspects for the endpoints. We can enable access to all the endpoints using application.properties
#we can access All our actuator endpoints without requiring authentication
management.endpoints.web.exposure.include=*
We would need to add custom security configuration that allows unauthenticated access to the endpoints if Spring Security is present. Please refer to the documentation for the list of out of the box endpoints
5. Monitoring Application Using Spring Boot 2
Spring boot actuator creates and expose the end points. Actuator end points allow us to monitor and interact with our application. Spring Boot 2 provides the option to expose these end points as JMX or HTTP end points. These different end points provide specific information / status for our application, let’s briefly cover a few of these endpoints.
- The
healthendpoint provides basic application health information. - To get the basic information like memory usage or CPU details, we can the
healthendpoint
We will cover these endpoints in more in the next section of this post. Actuator framework provides the flexibility to enable and disable individual endpoints. In case we like to consume these endpoints remotely we should expose these end points via JMX or HTTP.
Let’s start our application to see the actuator in action.Once you start the application open the following URL in your browser https://localhost:8080//actuator .Make sure to change the URL based on your application configurations:
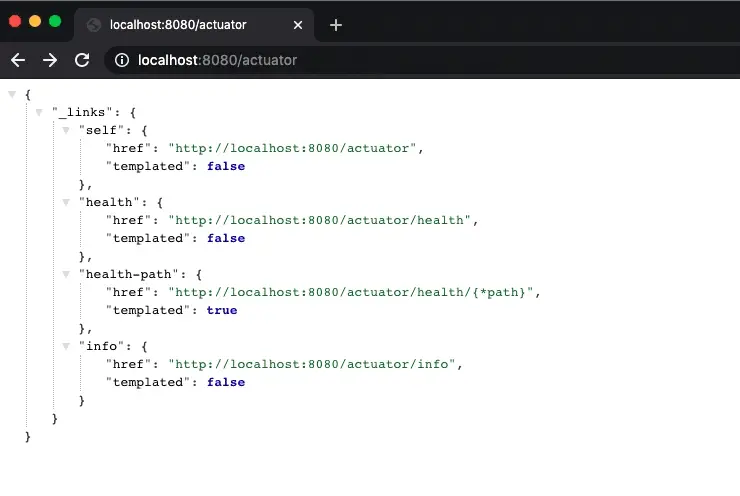
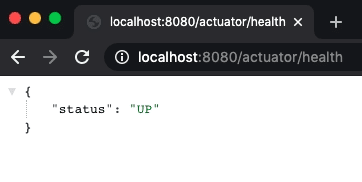
These are the default end point exposed by Spring boot actuator.Let’s check the information exposed by the health endpoint.We can either click on the health endpoint link or open the http://localhost:8080/actuator/health URL in the browser.The end point display following information:
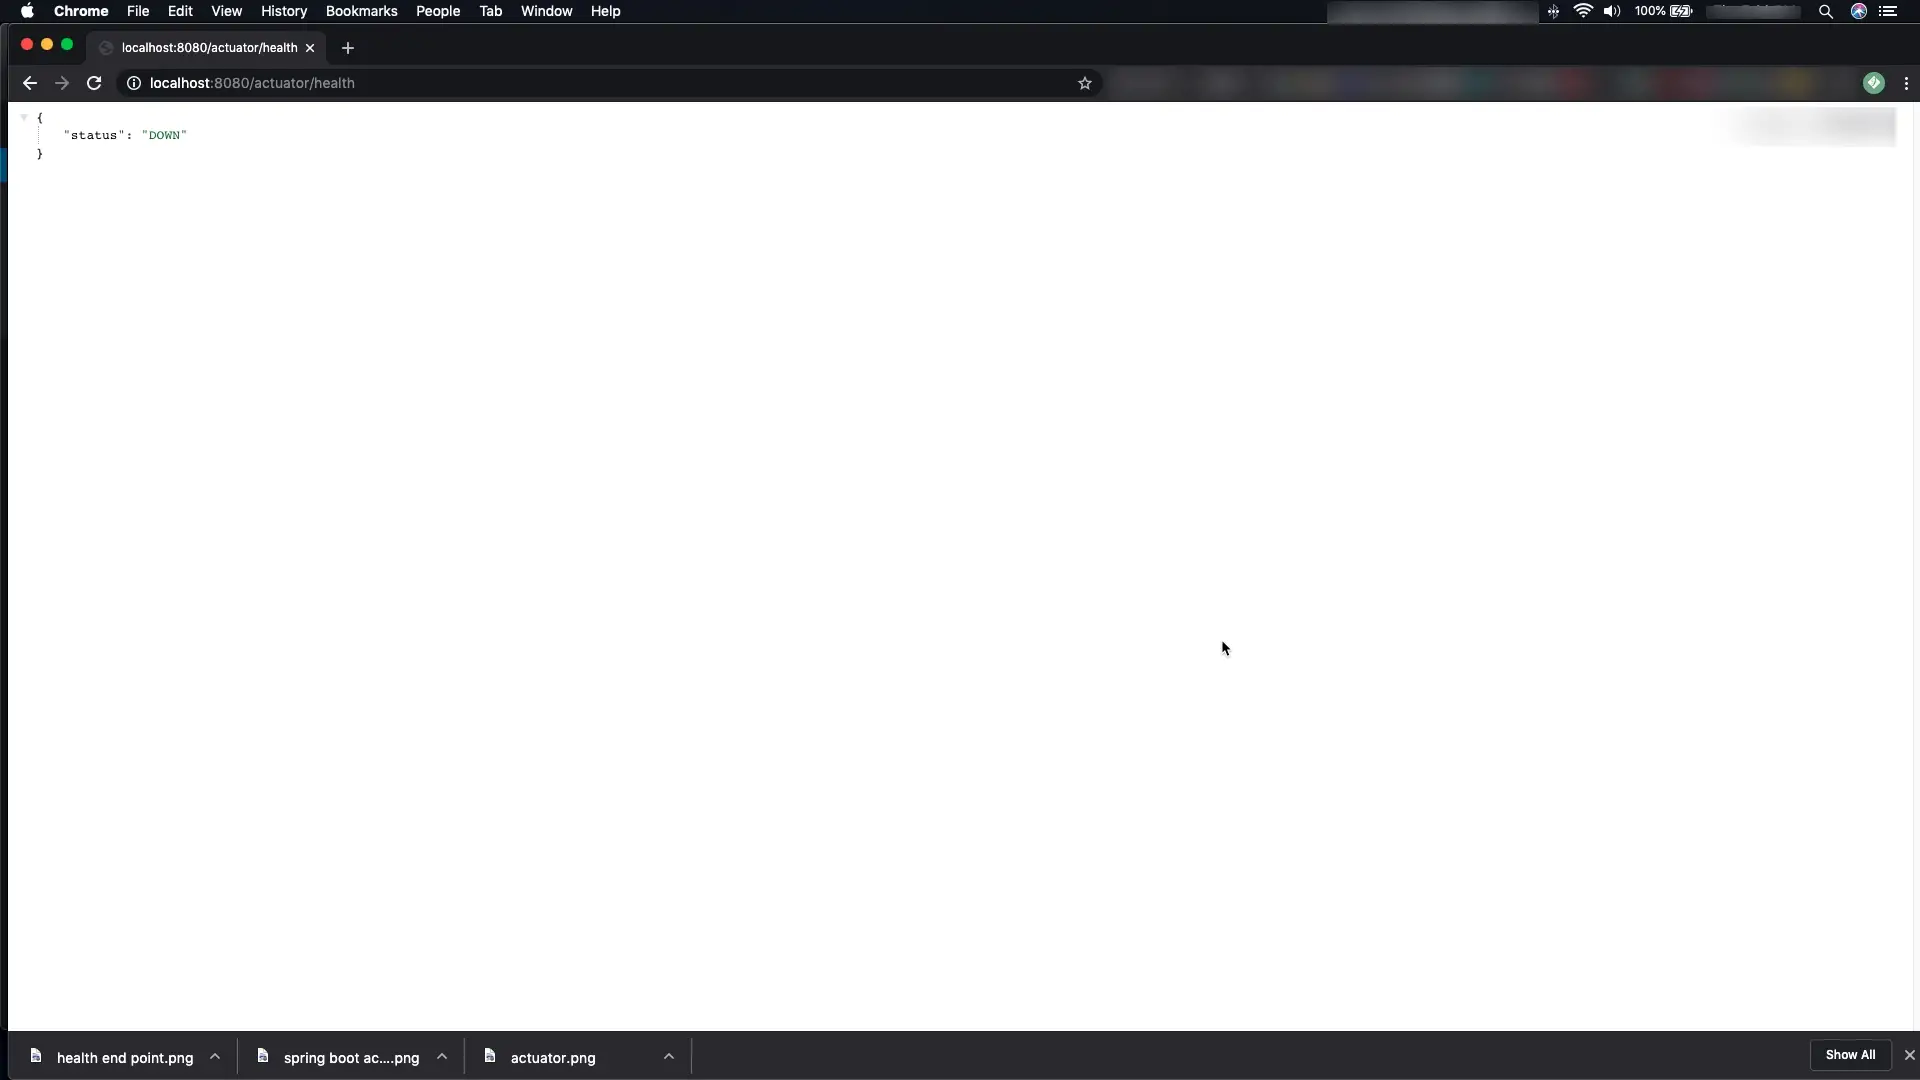
The health endpoint will show status as DOWN if there is any issue within the application like database connection or lower disk space etc. Here is an example of the same endpoint with an application where database is down (I did that to show the change in status).The server console looks like
2019-12-26 19:27:17.926  WARN 5207 --- [nio-8080-exec-2] com.zaxxer.hikari.pool.PoolBase          : HikariPool-1 - Failed to validate connection com.mysql.cj.jdbc.ConnectionImpl@775e388b (No operations allowed after connection closed.). Possibly consider using a shorter maxLifetime value.
2019-12-26 19:27:17.928  WARN 5207 --- [nio-8080-exec-2] com.zaxxer.hikari.pool.PoolBase          : HikariPool-1 - Failed to validate connection com.mysql.cj.jdbc.ConnectionImpl@15dee350 (No operations allowed after connection closed.). Possibly consider using a shorter maxLifetime value.
2019-12-26 19:27:17.930  WARN 5207 --- [nio-8080-exec-2] com.zaxxer.hikari.pool.PoolBase          : HikariPool-1 - Failed to validate connection com.mysql.cj.jdbc.ConnectionImpl@13421b00 (No operations allowed after connection closed.). Possibly consider using a shorter maxLifetime value.
2019-12-26 19:27:17.932  WARN 5207 --- [nio-8080-exec-2] com.zaxxer.hikari.pool.PoolBase          : HikariPool-1 - Failed to validate connection com.mysql.cj.jdbc.ConnectionImpl@2d40c048 (No operations allowed after connection closed.). Possibly consider using a shorter maxLifetime value.
2019-12-26 19:27:17.933  WARN 5207 --- [nio-8080-exec-2] com.zaxxer.hikari.pool.PoolBase          : HikariPool-1 - Failed to validate connection com.mysql.cj.jdbc.ConnectionImpl@187212a6 (No operations allowed after connection closed.). Possibly consider using a shorter maxLifetime value.
2019-12-26 19:27:17.935  WARN 5207 --- [nio-8080-exec-2] com.zaxxer.hikari.pool.PoolBase          : HikariPool-1 - Failed to validate connection com.mysql.cj.jdbc.ConnectionImpl@7a54a69b (No operations allowed after connection closed.). Possibly consider using a shorter maxLifetime value.
2019-12-26 19:27:17.936  WARN 5207 --- [nio-8080-exec-2] com.zaxxer.hikari.pool.PoolBase          : HikariPool-1 - Failed to validate connection com.mysql.cj.jdbc.ConnectionImpl@79cd28ca (No operations allowed after connection closed.). Possibly consider using a shorter maxLifetime value.
2019-12-26 19:27:17.937  WARN 5207 --- [nio-8080-exec-2] com.zaxxer.hikari.pool.PoolBase          : HikariPool-1 - Failed to validate connection com.mysql.cj.jdbc.ConnectionImpl@5224e53b (No operations allowed after connection closed.). Possibly consider using a shorter maxLifetime value.
2019-12-26 19:27:17.938  WARN 5207 --- [nio-8080-exec-2] com.zaxxer.hikari.pool.PoolBase          : HikariPool-1 - Failed to validate connection com.mysql.cj.jdbc.ConnectionImpl@5acb3afb (No operations allowed after connection closed.). Possibly consider using a shorter maxLifetime value.
2019-12-26 19:27:17.944  WARN 5207 --- [nio-8080-exec-2] com.zaxxer.hikari.pool.PoolBase          : HikariPool-1 - Failed to validate connection com.mysql.cj.jdbc.ConnectionImpl@5743f47 (No operations allowed after connection closed.). Possibly consider using a shorter maxLifetime value.
2019-12-26 19:27:47.918  WARN 5207 --- [nio-8080-exec-2] o.s.b.a.jdbc.DataSourceHealthIndicator   : DataSource health check failed
If you open the health endpoint again, we will have the following output.
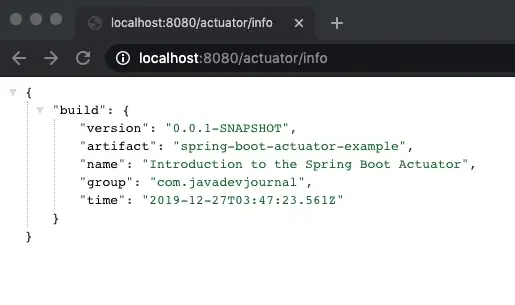
The info endpoint display general information from the standard files like META-INF/build-info.properties. This is a sample output for the info endpoint
For the HTTP, it exposes onlyinfo andhealth endpoints. There are several other endpoints available with the actuator but we need to enable these endpoints to be available through HTTP.
6. Spring Boot Actuator Endpoints
Here are the list of actuator endpoints available OOTB.
| ID | Description |
|---|---|
|
|
Exposes audit events information for the current application. Requires an |
|
|
Displays a complete list of all the Spring beans in your application. |
|
|
Exposes available caches. |
|
|
Shows the conditions that were evaluated on a configuration and auto-configuration classes and the reasons they did or did not match. |
|
|
Displays a collated list of all |
|
|
Exposes properties from Spring’s |
|
|
Shows any Flyway database migrations that have been applied. Requires one or more |
|
|
Shows application health information. |
|
|
Displays HTTP trace information (by default, the last 100 HTTP request-response exchanges). Requires an |
|
|
Displays arbitrary application info. |
|
|
Shows the Spring Integration graph. Requires a dependency on |
|
|
Shows and changes the configuration of loggers in the application. |
|
|
Shows any Liquibase database migrations that have been applied. Requires one or more |
|
|
Shows ‘metrics’ information for the current application. |
|
|
Displays a collated list of all |
|
|
Displays the scheduled tasks in your application. |
|
|
Allows retrieval and deletion of user sessions from a Spring Session-backed session store. Requires a Servlet-based web application using Spring Session. |
|
|
Lets the application be gracefully shutdown. Disabled by default. |
|
|
Performs a thread dump. |
There additional endpoints are only available for Spring MVC, Spring WebFlux, or Jersey.
| ID | Description |
|---|---|
|
|
Returns an |
|
|
Exposes JMX beans over HTTP (when Jolokia is on the classpath, not available for WebFlux). Requires a dependency on |
|
|
Returns the contents of the logfile (if |
|
|
Exposes metrics in a format a Prometheus server can scrape that. Requires a dependency on |
[pullquote align=”normal”]Please refer to the documentation to get the update list of the endpoints. [/pullquote]
7. Enable / Disable Actuator Endpoints
Spring boot actuator make it easy to enable or disable any end point using the application. properties file. To enable an endpoint, use the management.endpoint.<id>.enabled property in the application.properties file .Please refer to the section 5 to get the <id> of the endpoint. To toggle the endpoint set the value as true or false.To enable beans endpoint, add the following entry in our application.properties file:
management.endpoint.shutdown.enabled=trueExcept the shutdown, all other endpoints are active over the JMX, however for the HTTP, it exposes only 2 endpoints. To include / exclude the endpoint over HTTP, we should configure the following properties through the application.properties
management.endpoints.web.exposure.include=health,info
management.endpoints.web.exposure.exclude=
To expose all endpoints over HTTP, use the following properties
#we can access All our actuator endpoints without requiring authentication
management.endpoints.web.exposure.include=*
[pullquote align=”normal”]It’s not recommended to expose all end point using *. This can lead to security issues. [/pullquote]
Let’s see what all endpoints are available once we use the above configuration in our application.properties file.

Let’s explore some endpoints available with Spring Boot actuator.
7.1 /metrics Endpoint
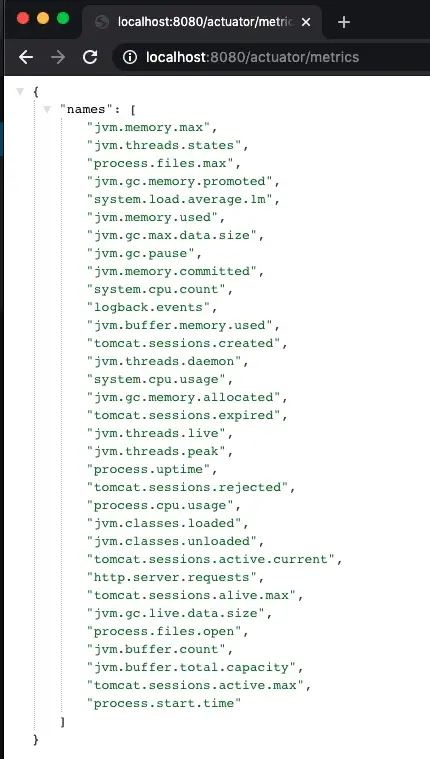
The metrics endpoint publishes information about the current application which includes OS, JVM information, memory and heap information, thread pool, etc.
Actuator also provide an option to get details of the individual metrics by passing the individual metrics name.Here is the signature for this:
"metrics-requiredMetricName": {
"href": "http://localhost:8080/actuator/metrics/{requiredMetricName}",
"templated": true
}
To check the metrics for the thread details, use the following the http://localhost:8080/actuator/metrics/jvm.threads.states.This will display details in JSON format:
{
   "name":"jvm.threads.states",
   "description":"The current number of threads having TERMINATED state",
   "baseUnit":"threads",
   "measurements":[
      {
         "statistic":"VALUE",
         "value":22
      }
   ],
   "availableTags":[
      {
         "tag":"state",
         "values":[
            "timed-waiting",
            "new",
            "runnable",
            "blocked",
            "waiting",
            "terminated"
         ]
      }
   ]
}
7.2 /health Endpoint
The /health endpoint is to check the health or state of the running application. With standard setup this endpoint only display a simple status of the application like up or DOWN.This endpoint is also capable of provide you more information related to application health like.
- What health indicator checked included in the response.
- Any custom health indicator which was part of the configuration.
To enable these details, add the following property in the application.properties file.
management.endpoint.health.show-details=alwaysLet’s restart our application and try to see the output of the health endpoint again:
{
   "status":"UP",
   "components":{
      "db":{
         "status":"UP",
         "details":{
            "database":"MySQL",
            "result":1,
            "validationQuery":"/* ping */ SELECT 1"
         }
      },
      "diskSpace":{
         "status":"UP",
         "details":{
            "total":121123069952,
            "free":30862852096,
            "threshold":10485760
         }
      },
      "ping":{
         "status":"UP"
      }
   }
}
Let’s take an example when our database server is down.In this case our /health endpoint response will look like:
{
   "status":"DOWN",
   "components":{
      "db":{
         "status":"DOWN",
         "details":{
            "error":"org.springframework.jdbc.CannotGetJdbcConnectionException: Failed to obtain JDBC Connection; nested exception is java.sql.SQLTransientConnectionException: HikariPool-1 - Connection is not available, request timed out after 30004ms."
         }
      },
      "diskSpace":{
         "status":"UP",
         "details":{
            "total":121123069952,
            "free":30875279360,
            "threshold":10485760
         }
      },
      "ping":{
         "status":"UP"
      }
   }
}
Spring Boot Actuator comes with many HealthIndicators.For a complete list, please refer to the official documentation.To disable a specific health indicator, use the management.health.<id>.enabled property in the application.properties file.
management.health.diskSpace.enabled=falseHere is the output on disabling the disk space health check
{
   "status":"UP",
   "components":{
      "db":{
         "status":"UP",
         "details":{
            "database":"MySQL",
            "result":1,
            "validationQuery":"/* ping */ SELECT 1"
         }
      },
      "ping":{
         "status":"UP"
      }
   }
}
7.3 /bean Endpoint
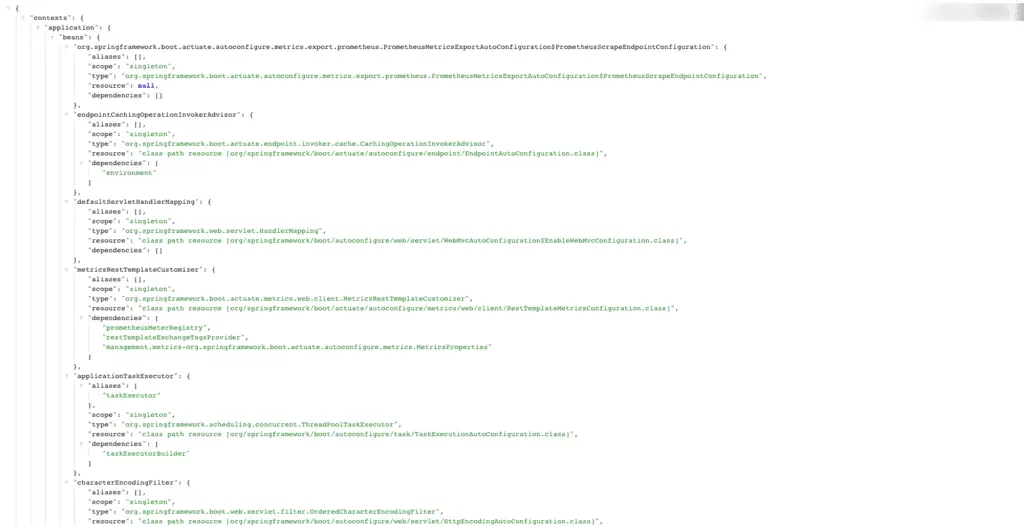
The bean endpoint displays a complete list of all the Spring Bean in our application. This endpoint provides information like bean name, aliases, bean scope, bean type (class name), bean dependencies. The /bean endpoints give a snapshot of the Spring IoC. Here is a sample output for this endpoint:
7.4 /loggers Endpoint
To check the list of all configured logger for our application, we can use the http://localhost:8080/actuator/loggers endpoint.This endpoint display all the logger and configured log levels.
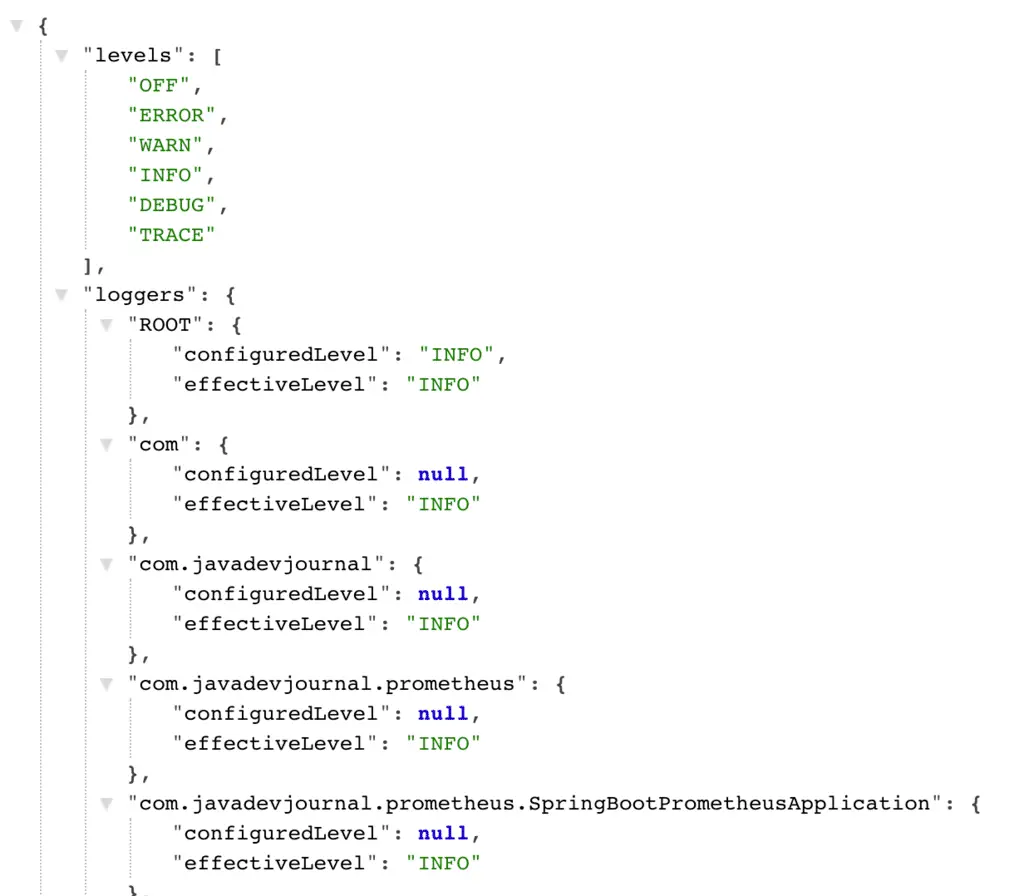
It also provides the option to check the details for the individual logger.Use the URL http://localhost:8080/actuator/loggers/{name} where {name} is the name of the logger.To check the details for the {com.javdevjournal} logger, use the http://localhost:8080/actuator/loggers/com.javadevjournal.Here is the sample output for this URL
{
   "configuredLevel":null,
   "effectiveLevel":"INFO"
}
7.5 Changing Log Level
The actuator framework is flexible and provide options to change the log level at run time. This is an amazing feature to debug application issue with no code deployment (provided we have added logging information to our application).To change the log level, send a post request to specific logger with the required change. Let’s take an example of our previous section where we like to change the log level for our com.javdevjournal logger from {INFO} to {DEBUG}. To do this, follow these steps:
- Send a POST request to the http://localhost:8080/actuator/loggers/com.javadevjournal.
- The POST requests should contain the following payload.
{"configuredLevel":"DEBUG"}Let’s send a post request to see this change in real time:
curl -X POST \
  http://localhost:8080/actuator/loggers/com.javadevjournal \
  -H 'cache-control: no-cache' \
  -H 'content-type: application/json' \
  -H 'postman-token: 432e886e-cd40-50ad-32c9-147a158b1ef5' \
  -d '{"configuredLevel":"DEBUG"}'
Check the update status for the logger by hitting the http://localhost:8080/actuator/loggers/com.javadevjournal.Here is the sample output for this URL
{
   "configuredLevel":DEBUG,
   "effectiveLevel":"DEBUG"
}
7.6 /info Endpoint
The info endpoint displays arbitrary application info. We can customize the data shown in the info endpoint using <code class=""” language-properties">application.properties
info.app.name=Spring Actuator Sample Application
info.app.description=Application to demonstarte features and capabilities of Spring Boot Actuator
info.app.version=1.0.0
Here is the output for this endpoint.
{
   "app":{
      "description":"Application to demonstarte features and capabilities of Spring Boot Actuator ",
      "name":"Spring Actuator Sample Application",
      "version":"1.0.0"
   }
}
8. Creating a Custom Endpoint
Spring Boot provides an easy way to create custom endpoints.Spring Boot 2.x introduced @Endpoint annotation. The @Endpoint annotation can be combined with @ReadOperation,@WriteOperation and @DeleteOperation to develop endpoints.Let’s create a custom endpoint:
@Component
@Endpoint(id = "custom-endpoint")
public class CustomEndpoint{
@ReadOperation
public String custom() {
return "custom-end-point";
}
@ReadOperation
public String customEndPointByName(@Selector String name) {
return "custom-end-point";
}
@WriteOperation
public void writeOperation(@Selector String name) {
//perform write operation
}
@DeleteOperation
public void deleteOperation(@Selector String name){
//delete operation
}
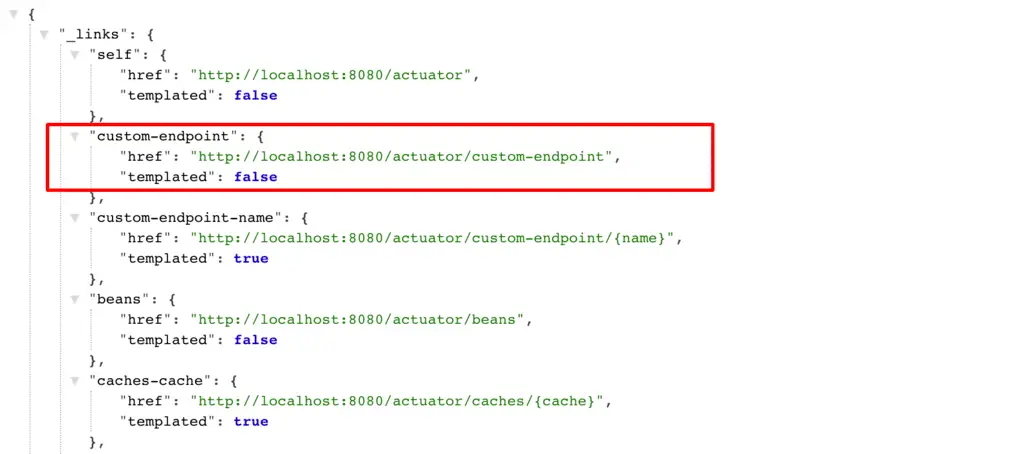
}If we open the http://localhost:8080/actuator/ URL, we can see our custom endpoint in the list
8.1 Extending Existing Endpoints
Spring boot actuator makes it it easy to extend the behavior of an existing endpoint with the help of @EndpointExtension annotation. Let’s take an example of CustomHealthEndpoint where we want to send custom status code as part of the web endpoint. To achieve this we use @EndpointWebExtension annotation.
package org.springframework.boot.actuate.healthr;
import org.springframework.boot.actuate.endpoint.annotation.ReadOperation;
import org.springframework.boot.actuate.endpoint.web.WebEndpointResponse;
import org.springframework.boot.actuate.endpoint.web.annotation.EndpointWebExtension;
import org.springframework.boot.actuate.health.Health;
import org.springframework.boot.actuate.health.HealthEndpoint;
import org.springframework.stereotype.Component;

@Component
@EndpointWebExtension(endpoint = HealthEndpoint.class)
public class HealthEndpointWebExtension {

    private HealthEndpoint delegate;

    @ReadOperation
    public WebEndpointResponse < Health > getHealth() {
        Health health = (Health) this.delegate.health();
        Integer status = getCustomStatus();
        return new WebEndpointResponse < > (health, status);
    }

    public Integer getCustomStatus() {
        return 200;
    }
}
For this approach you need to set the package same with spring one: package org.springframework.boot.actuate.health; to ensure it override the spring’s bean. Other option is to implement the HealthIndicator interface, or extending the AbstractHealthIndicator class:
@Component
public class CustomHealthIndicator extends AbstractHealthIndicator {

    @Override
    protected void doHealthCheck(Health.Builder builder) throws Exception {
        builder.up()
            .withDetail("app", "All Good!!")
            .withDetail("error", "No issue");
    }
}
Let’s see how the output look like with this customization:
{
   "status":"UP",
   "components":{
      "custom":{
         "status":"UP",
         "details":{
            "app":"All Good!!",
            "error":"No issue"
         }
      },
      "diskSpace":{
         "status":"UP",
         "details":{
            "total":121123069952,
            "free":30847619072,
            "threshold":10485760
         }
      },
      "ping":{
         "status":"UP"
      }
   }
}
9. Additional Customization
Spring Boot Actuator provides several options for the additional customization using application.properties file. Below are some important properties to customize the Actuator.
#Disable security feature for all end points.By default all sensitive HTTP endpoints are secure.
management.security.enabled=false

#Customizing the management endpoint paths.All endpoints will be accessible through manage/endpoint
management.context-path=/manage

#Property to configure /change management server port.All endpoints will be accessible only through this port
management.port=9001

#customize the address that the management endpoints.
management.address=127.0.0.1

#disable endpoint over HTTP
management.port=-1
Actuator endpoints (with property sensitive as true) are secured. We can use Spring Boot application.properties file to change the username and password and the security role(s) required to use the endpoints.
security.user.name=admin
security.user.password=secret
management.security.roles=SUPERUSER
10. Securing Actuator Endpoints
Spring boot actuator provides several endpoints with sensitive data and we must secure these endpoints on the production environment to avoid exposing unauthorized access to this data. In case Spring security configured for our project, Spring boot by default secure these endpoints by enabling an HTTP based authentication. We can easily enable this security by adding spring security in our application.
<dependency>
   <groupId>org.springframework.boot</groupId>
   <artifactId>spring-boot-starter-security</artifactId>
</dependency>
Above provides a basic HTTP authentication. Let’s see how we can customize this security for actuator endpoints:
public class CustomSecurityConfig extends WebSecurityConfigurerAdapter {

    @Override
    protected void configure(HttpSecurity http) throws Exception {
        http
                .authorizeRequests()
                .requestMatchers(EndpointRequest.to(ShutdownEndpoint.class, HealthEndpoint.class))
                .hasRole("ADMIN")
                .requestMatchers(EndpointRequest.toAnyEndpoint())
                .permitAll()
                .requestMatchers(PathRequest.toStaticResources().atCommonLocations())
                .permitAll()
                .antMatchers("/")
                .permitAll()
                .antMatchers("/**")
                .authenticated()
                .and()
                .httpBasic();
    }
}
In the above code, we are performing the following security checks:
- Restricting the health and shutdown endpoints to a person with admin role only.
- Other actuator endpoints are accessible without any security restrictions.
- No restrictions on the static resources.
- For this post, using the basic HTTP authentication but use other more secure approach for your production environment.
As the last step, we need to add default username and password in the application.properties file.
# Spring Security Default user name and password
spring.security.user.name=admin
spring.security.user.password=nimda
spring.security.user.roles=ADMIN
Let’s start our application and try to open the /health or /shutdown endpoint.
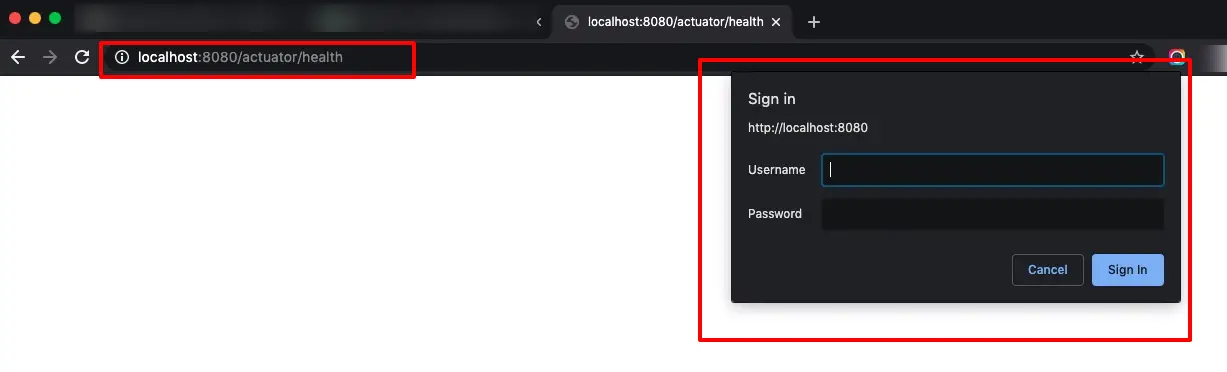
Since we added security check to the /health or /shutdown endpoint, when someone tries to access these secure actuator endpoints, they will be prompted with the sign in box for authentication. Once we add the correct username and password, we will get the expected output. If we try to open any non secure endpoints, system will not force us to add the username and password (until we add it to spring security configuration).
11. Caching Actuator Endpoints
Actuator automatically cache response for all endpoints which do not take any parameter (Mostly read operations). Spring boot provides an option to configure and control the caching properties for these endpoints by using the cache.time-to-live property. Let’s take an example where we like to set the time-to-live of the beans endpoint’s cache to 10 seconds:
management.endpoint.beans.cache.time-to-live=10s
12. CORS Support
CORS (Cross-origin resource sharing) allows a webpage to request additional resources into browser from other domains e.g. fonts, CSS or static images from CDNs. CORS is a W3C specification which provides options for the CORS request. Spring 4.2+ provides build in support to for the Cross-origin resource sharing.CORS support is disabled by default on the actuator endpoints.To enable the CORS support for the spring boot actuator endpoints, add the management.endpoints.web.cors.allowed-origins property in the application.properties file along with information about the allowed methods.
management.endpoints.web.cors.allowed-origins=https://javadevjournal.com
management.endpoints.web.cors.allowed-methods=GET,POST
[pullquote align=”normal”] The allowed-origins properties take a comma-separated list of the origins.’*’ allows all origins. [/pullquote]
13. Change Management Server Port
There are certain use cases, where you do not want to expose the actuator endpoints on the default HTTP port. We may prefer to expose these endpoints on a different HTTP port. Spring Boot provides an option to configure this behaviour by using the management.server.port property. Let’s change the management endpoints to 8081.
management.server.port=8081When you run the application again, pay close attention to the server console. Spring Boot will spinoff tomcat with 2 HTTP port.
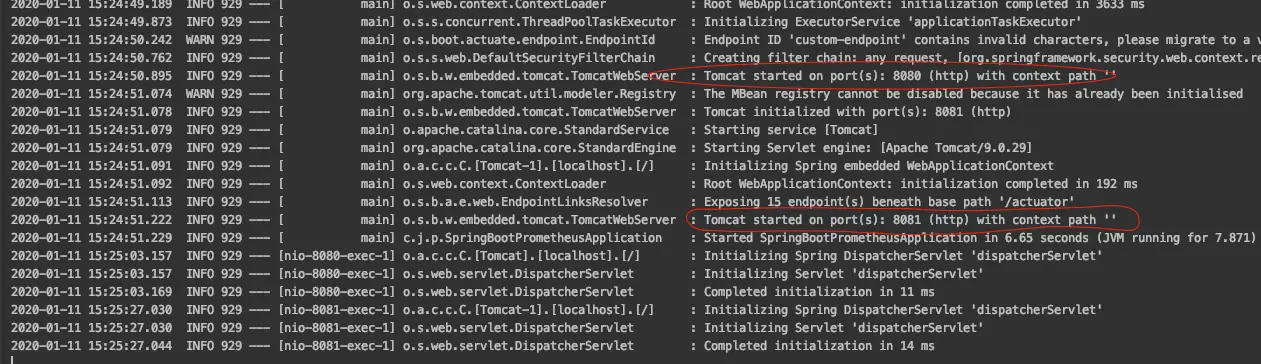
With this change, all the actuator endpoints are now available on 8081 HTTP port. Spring boot actuator also allow you to customize the management server. Let’s take an example where we like to expose these endpoints only to the internal network or like to listen only for connections from localhost.We can configure this by using the management.server.address property.
management.server.port=8081
management.server.address=127.0.0.1
[sc_fs_multi_faq headline-0=”h2″ question-0=”What is spring boot actuator?” answer-0=”Spring Boot Actuator is available from the very first release of Spring Boot. It provides several features like health check-up, auditing JVM metrics, log information, caching statics, etc. Spring actuator provide HTTP endpoints useful to monitor your production application.” image-0=”” headline-1=”h2″ question-1=”What is Spring boot actuator endpoints?” answer-1=”Actuator endpoints allow us to monitor and interact with our application. Spring Boot provides several ready-to-use endpoints to monitor the application. It also gives us an option to create our own custom endpoints or extends the existing endpoints.” image-1=”” count=”2″ html=”true” css_class=””]
Summary
In this article, we discussed Spring Boot Actuator. We covered different features of the spring actuator. We discussed different endpoints available with the actuator. We als talked about how to customize the endpoints along with how to write a custom endpoint with spring boot actuator.Finally we covered the security and some advance topics for the actuator.
Great Explanation..!
Thanks!!!!
How we can use spring boot with jmx endpoint rather than http
Spring Boot exposes management endpoints as JMX MBeans under the org.springframework.boot domain.Have a look at the following documentation to see what all points are available over the JMX
https://docs.spring.io/spring-boot/docs/current/reference/html/production-ready-endpoints.html#production-ready-endpoints-exposing-endpoints.
To use the JMX remotely, you need to specify an RMO registry port.
Was “5.2. Extending Existing Endpoints” intended to leave the example of “CustomHealthEndpoint” up the imagination of the reader?
Hello Cris,
Thanks for your feedback, I will update it shortely. 🙂
Please correct the spelling of “Spring boot” in section 3 under 3. Spring Boot 1.x vs 2.x Actuator.
Thanks 🙂
Done.Thanks for the pointer 🙂